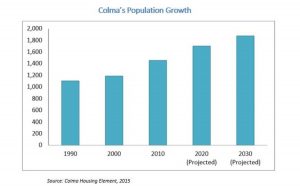
Population
According to the State of California Department of Finance the current Colma population is 1,729. The population increased in 1986 due to an annexation of existing housing units to the Sterling Park neighborhood and the addition of Veteran's Village housing in 2019.
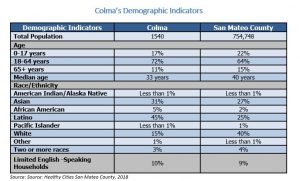
Age & Race
Colma is more diverse than San Mateo County as a whole. Latino and Asian populations compose the majority of Colma's racial demographics with 45% Latino and 31% Asian. Over the past decade, the white population has declined while the Asian population has grown. African American and white population is composed of 5% and 15%, respectively.
The average age in Colma has decreased. In 2000, the median age was 37 and in 2018 it was 33. This appears to be due to a growth in the 20-34 segments of the population, which grew from one-fifth of the total population in 2000 to a third in 2011. Almost 30 percent of Colma’s population is comprised of children under 19, and only 12 percent of the population includes seniors over the age of 60. Colma is the only city in San Mateo County whose population has gotten younger.
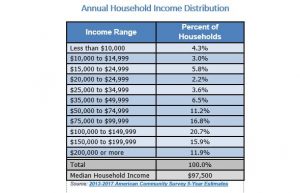
Income
In 2018, Colma had a median household income of $97,500. The median income in Colma is higher than the statewide average of $71,805 (2017) and slightly lower than the median income for San Mateo County which was $105,667 in 2018.